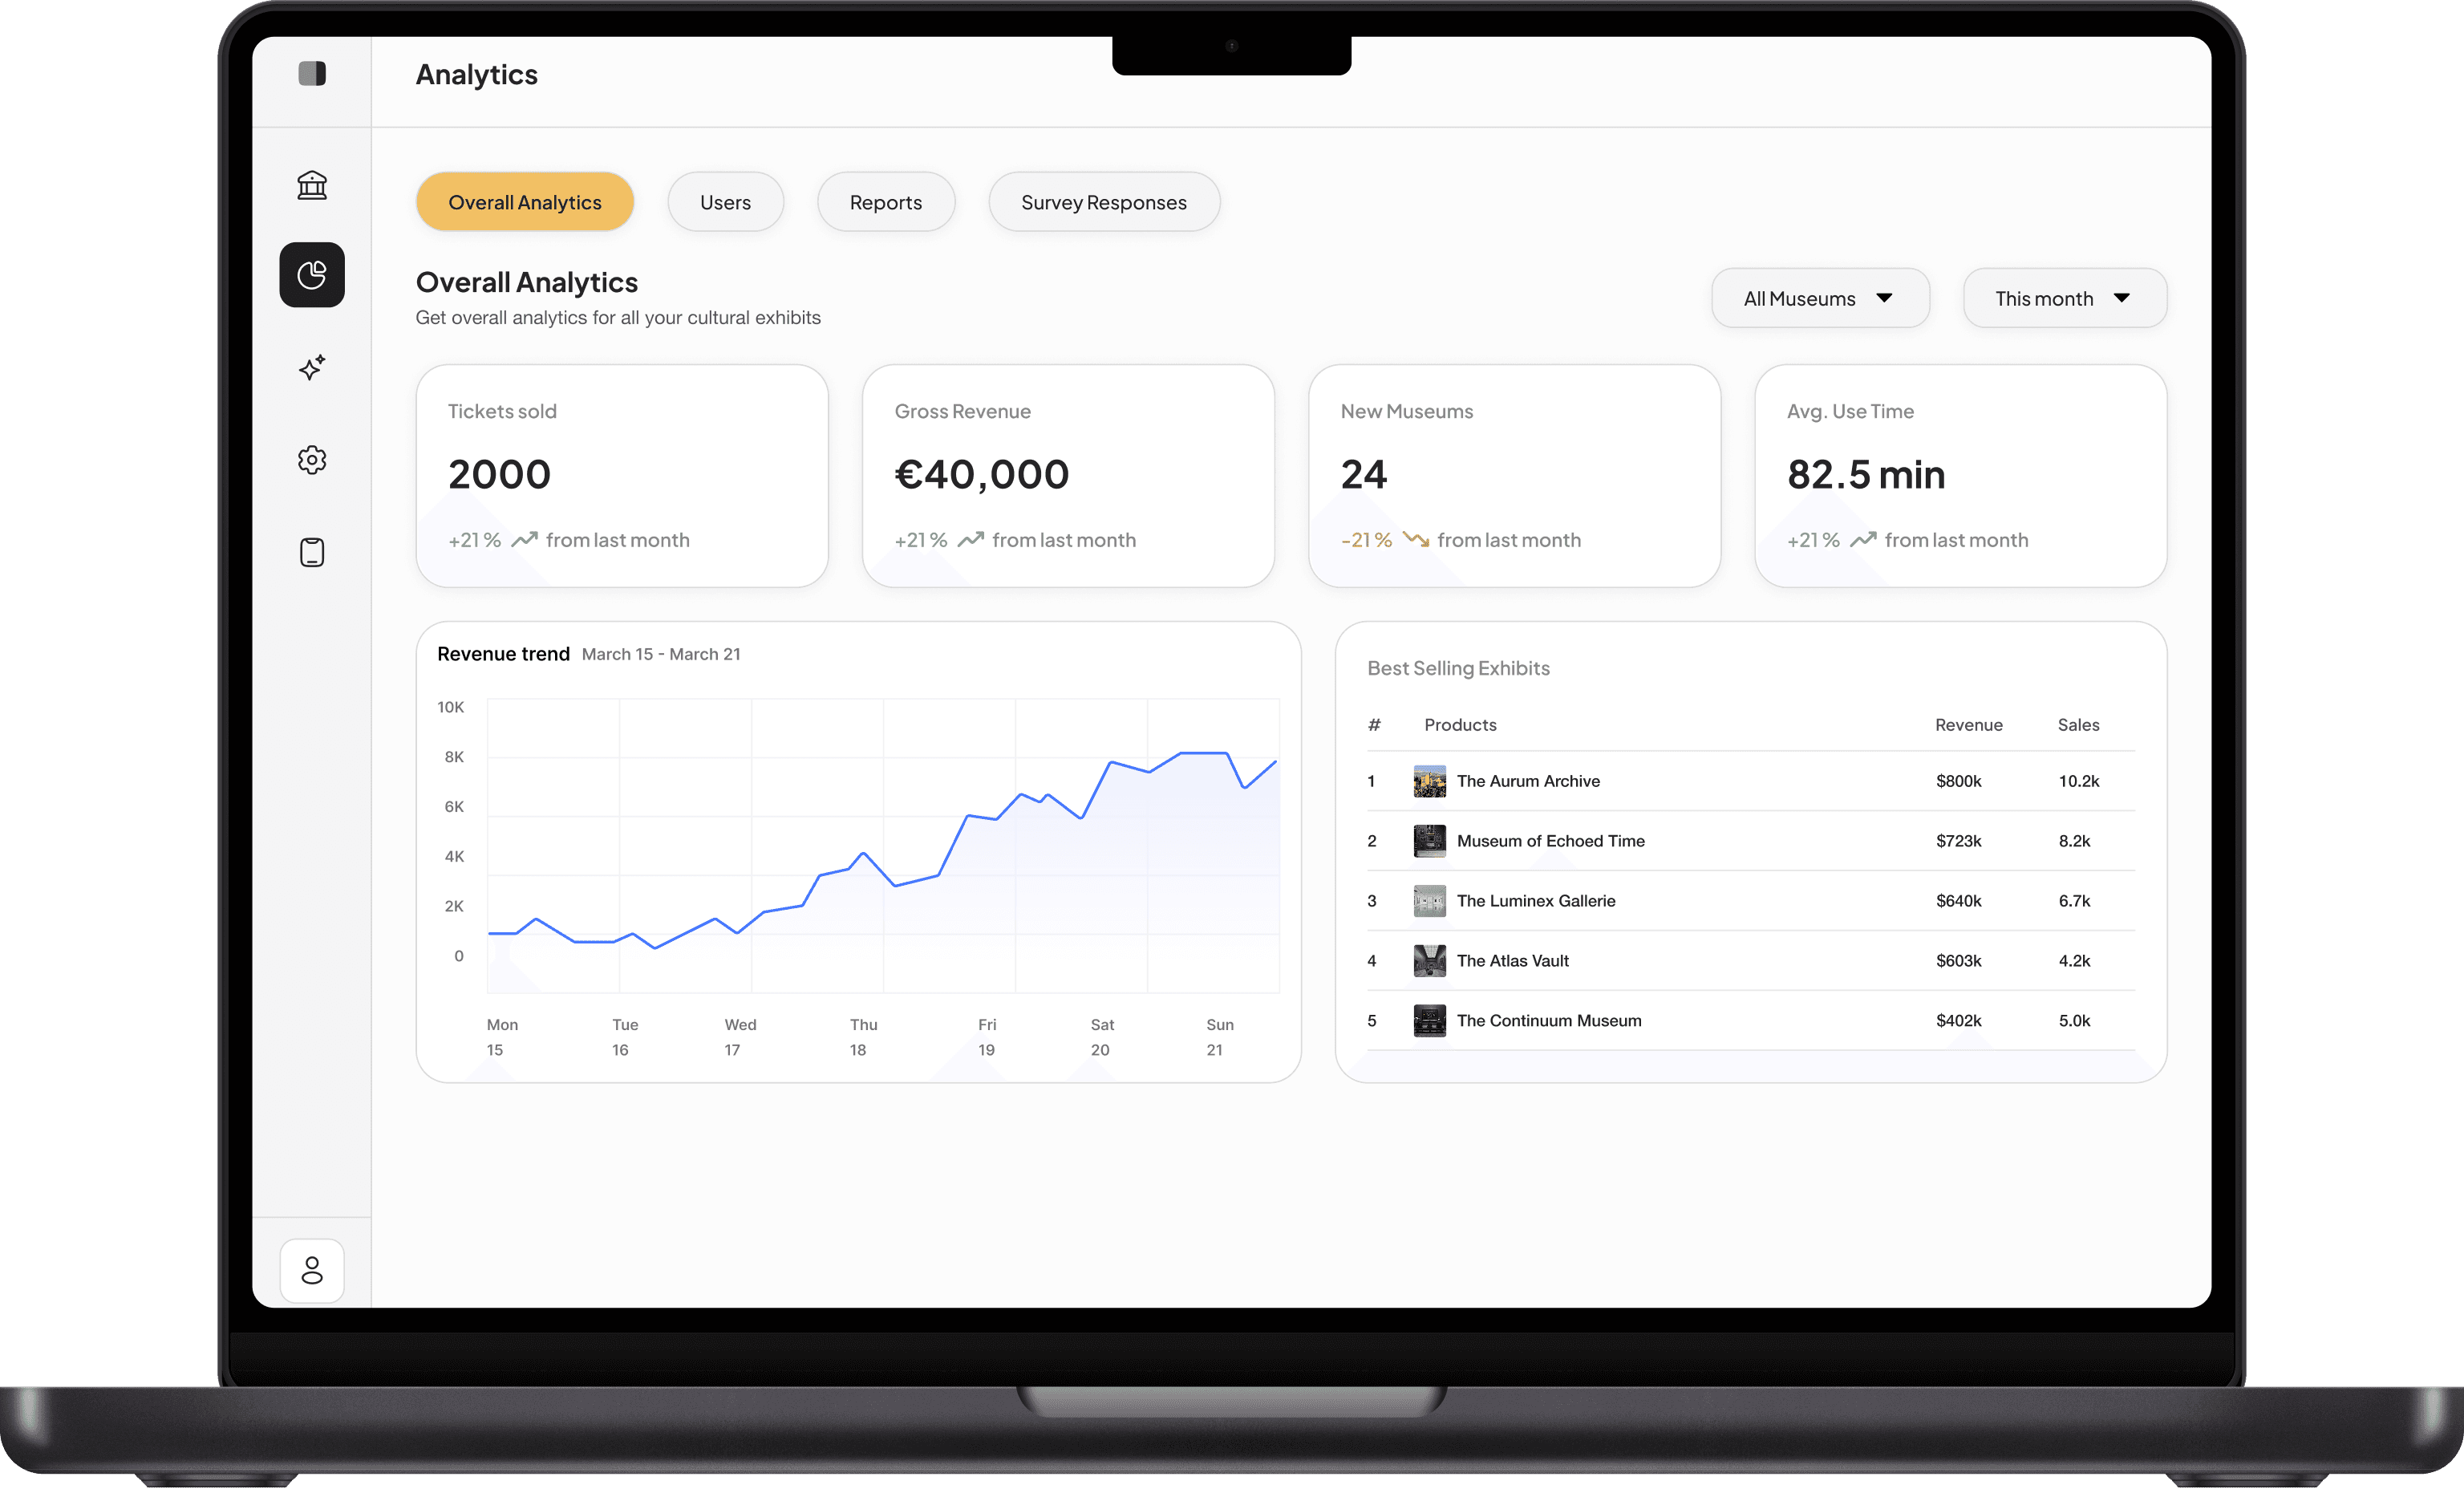
Data Dashboard
The Data Dashboard gives cultural exhibits a clear overview of how visitors engage with their digital experiences. It visualizes key insights—such as revenue, tour usage, artwork views, and visitor behavior—helping museums understand what’s working and make informed decisions.
Features
Visitor Engagement Insights
Track which exhibitions, artworks, and pages visitors interact with the most.
Tour Usage Analytics
See how many visitors start, continue, or complete guided tours.
Customizable Reports
Generate tailored reports for exhibitions, time periods, or content categories.
Museum-Specific KPIs
Track custom metrics based on the museum’s goals—such as exhibit popularity or seasonal performance.
Secure Role-Based Access
Allow staff members to view or manage analytics based on their assigned roles.
Custom Features
Full Brand Customization
We completely adapt the app to the museum’s identity — brand colors, typography, logos, icons, imagery, and overall UI theme.
Custom Home & Navigation Layouts
Design unique home screens, menu structures, and navigation flows based on how the museum wants visitors to explore.
Bespoke Tours & Storytelling
Create museum-specific tours with custom audio, visuals and storytelling styles tailored to each exhibition.
Custom Map & Floor Plans
Provide tailored metrics such as popular exhibits, tour usage, time spent per gallery, or visitor engagement trends.
Explore the Experience